
Eclipse Talks
Return to Basics:
Analytics & Interpretation in A/B Testing
Ellie Hughes
Head of Consulting
In this talk we return to basics in order to walk you through the essentials of setting up your AB test for analytics success.
Next we'll look at how you are collecting data to make sure you are taking the right approach.
Finally, we'll do a brief overview of how to analyse and interpret an AB test result.
STEP 1: AB Test Setup
A quick reminder of CRO concepts
STEP 2: Collecting Data
Are you targeting the right users?
Scoping and tagging
Best Practices for collecting data
STEP 3: Analysing and interpreting results
How do I know I have collected enough data?
Interpreting a result
Part 1: A quick reminder of CRO concepts
What is an experiment?
Any controlled manipulation of one or more factors where their effect on a result or outcome can be measured, in order to validate a theory or hypothesis.
Examples
“The quality of the website would be better if it was coded in React JS instead of Java.”
“We’d make more money from our site promotions if we offered them on all the product pages as well as the homepage.”
“The teams would work faster/deliver better if they used method X for sprint planning.”
Why experiment? What is the benefit?
Testing theory and mechanisms
Is my theory correct? How does this thing work? Which version is better?
Understanding magnitude
of outcomes and tradeoffs between different outcomes: Can I improve margin without negatively affecting orders/sales or conversion rate?
Evaluate large-scale changes
and policies: are individual changes having an effect, or is it the effect of the combination as a whole?
Fact Finding
Sometimes you don’t have a theory, you just want to know nothing is going to break or you are not missing out on an opportunity to innovate or learn
A/B Testing:
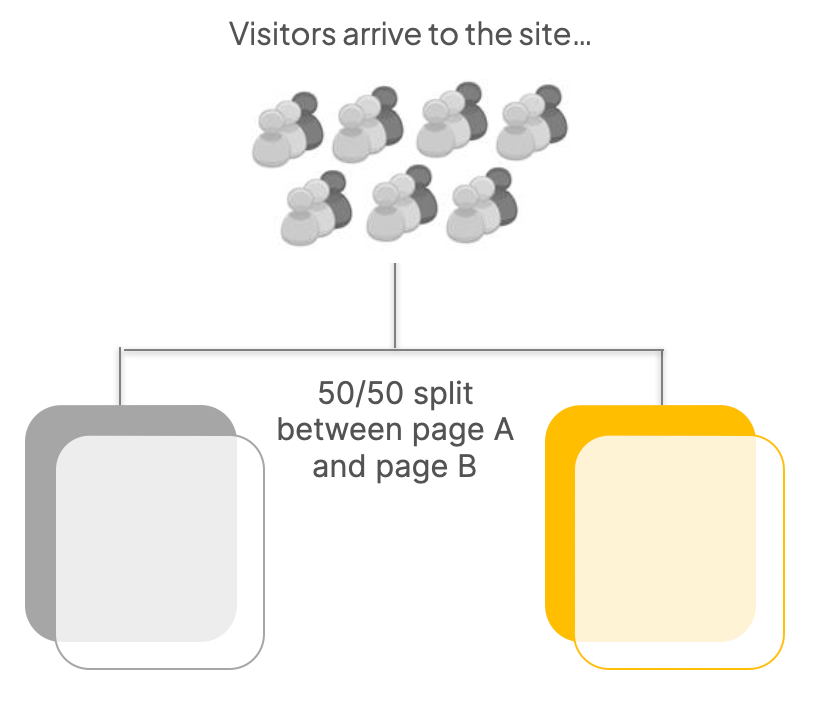
The AB testing tool randomly splits traffic between two (or more) page variations
Only one part of the page is varied, ie one hypothesis is being tested at once
The analytics tool tracks the behaviour of visitors who saw each variation and quantifies the impact on the outcome metric(s) of interest
This is usually expressed as lift or uplift (eg +5%)
Multivariate Testing:
Hypothesis-based approach to testing where different parts of the experience are systematically varied, such as:
Offer
Messaging
Layout
Journey
Functionality
Design
Confirm or reject individual hypotheses and understand the impact of each on conversion metrics, plus uncover the optimal combination

Personalisation:
Enabled by real-time visitor profiling and content delivery, in order to increase relevance to the customer and drive KPI improvements for the marketer.
Visitor Segmentation/Profiling
Experience Personalisation
Offer
Messaging
Layout
Marketers can take a user-defined or test & learn approach to experience personalisation

Part 2: Collecting Data
How do you ensure you are collecting the right data?
How many users you allow into your experiment is called “targeting” or “scoping”
Example:
In you are only showing a “discounted special offer” to new users who came from a specific channel like Paid Search or Social, you don’t want that heavy discount to be shown to irrelevant users
This will pollute your experiment data!
This will make a mess for users not meant to be in the experiment! People you don’t want to see the experience will be included
Imagine all the pages on your site through the funnel

If your experiment is relevant for every page of the site then you can include all pages in the audience

What if your experiment is only relevant for just one page?

Or just when a modal/pop-up opens on click?
This is why we use audiences or targeted tagging to activate users into an experiment
In this example, the audience is for users from Google Search Traffic
An experiment targeted this way would exclude anyone not from this source
You can test your experiment setup using an AA test to ensure the right people are included and no bias exists
Part 3: Analysing and interpreting results
How do I know I have collected enough data?
An experiment allows us to:
Sample (look at ‘some’)
Infer (apply to 'all’)
How many people do we need to have in our sample to enable us to accurately infer about the broader population?
As we are looking at a return to basics today, we’ll focus on a frequentist inference example: a simple coin toss.
Reminder:
The probability of flipping a coin and getting heads is 50% (the ‘true value’).
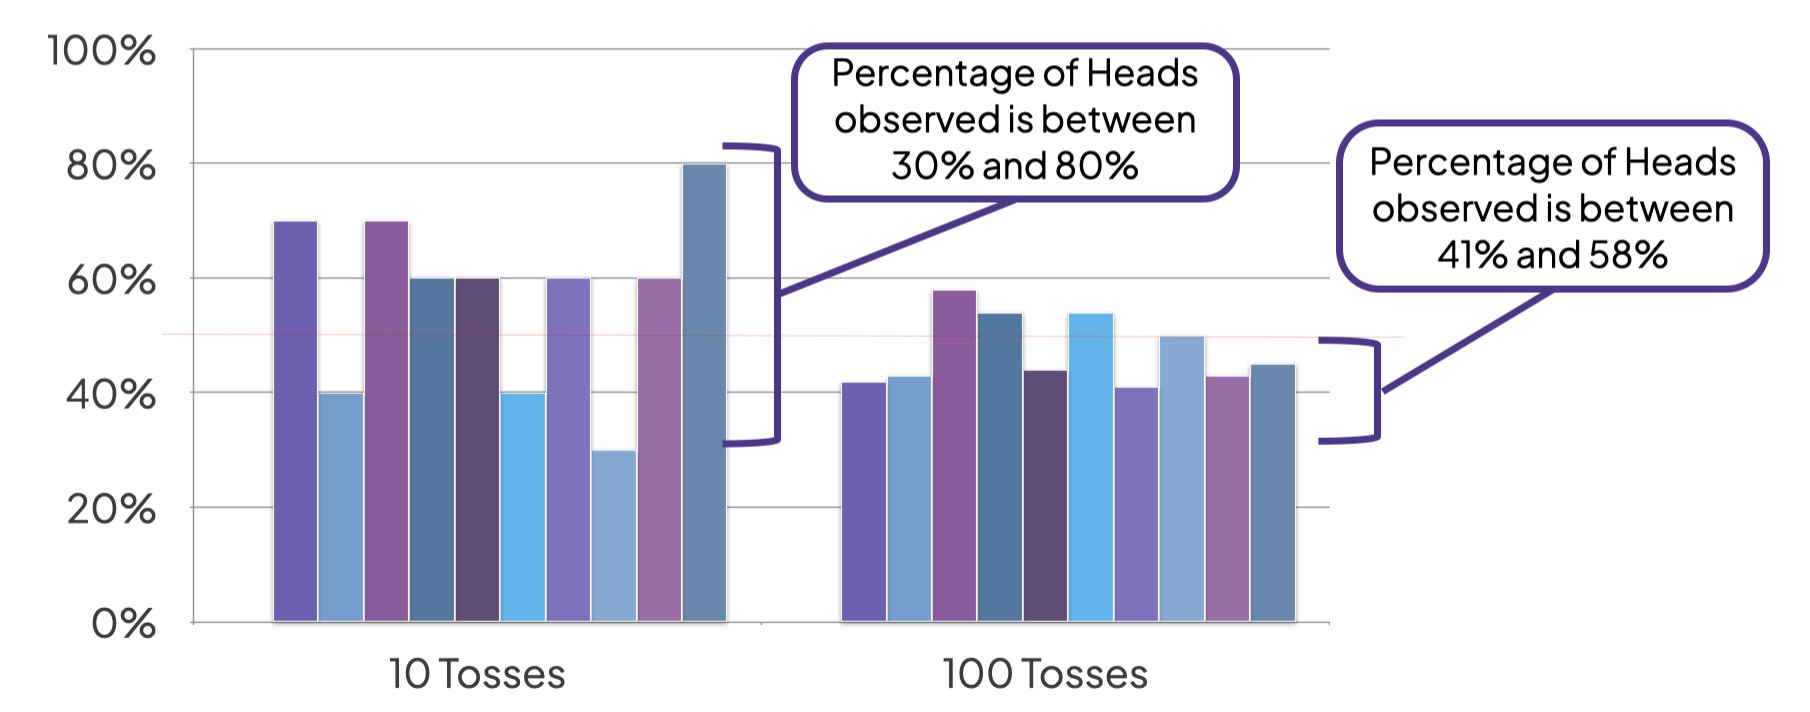
Left Graph: With a small sample size we do not necessarily see a 50% probability
Right Graph: With larger sample size we get closer to the 50%
-> Greater sampling narrows the confidence interval
The confidence interval is a measure of accuracy – it tells us the range in which the “true value” lies.
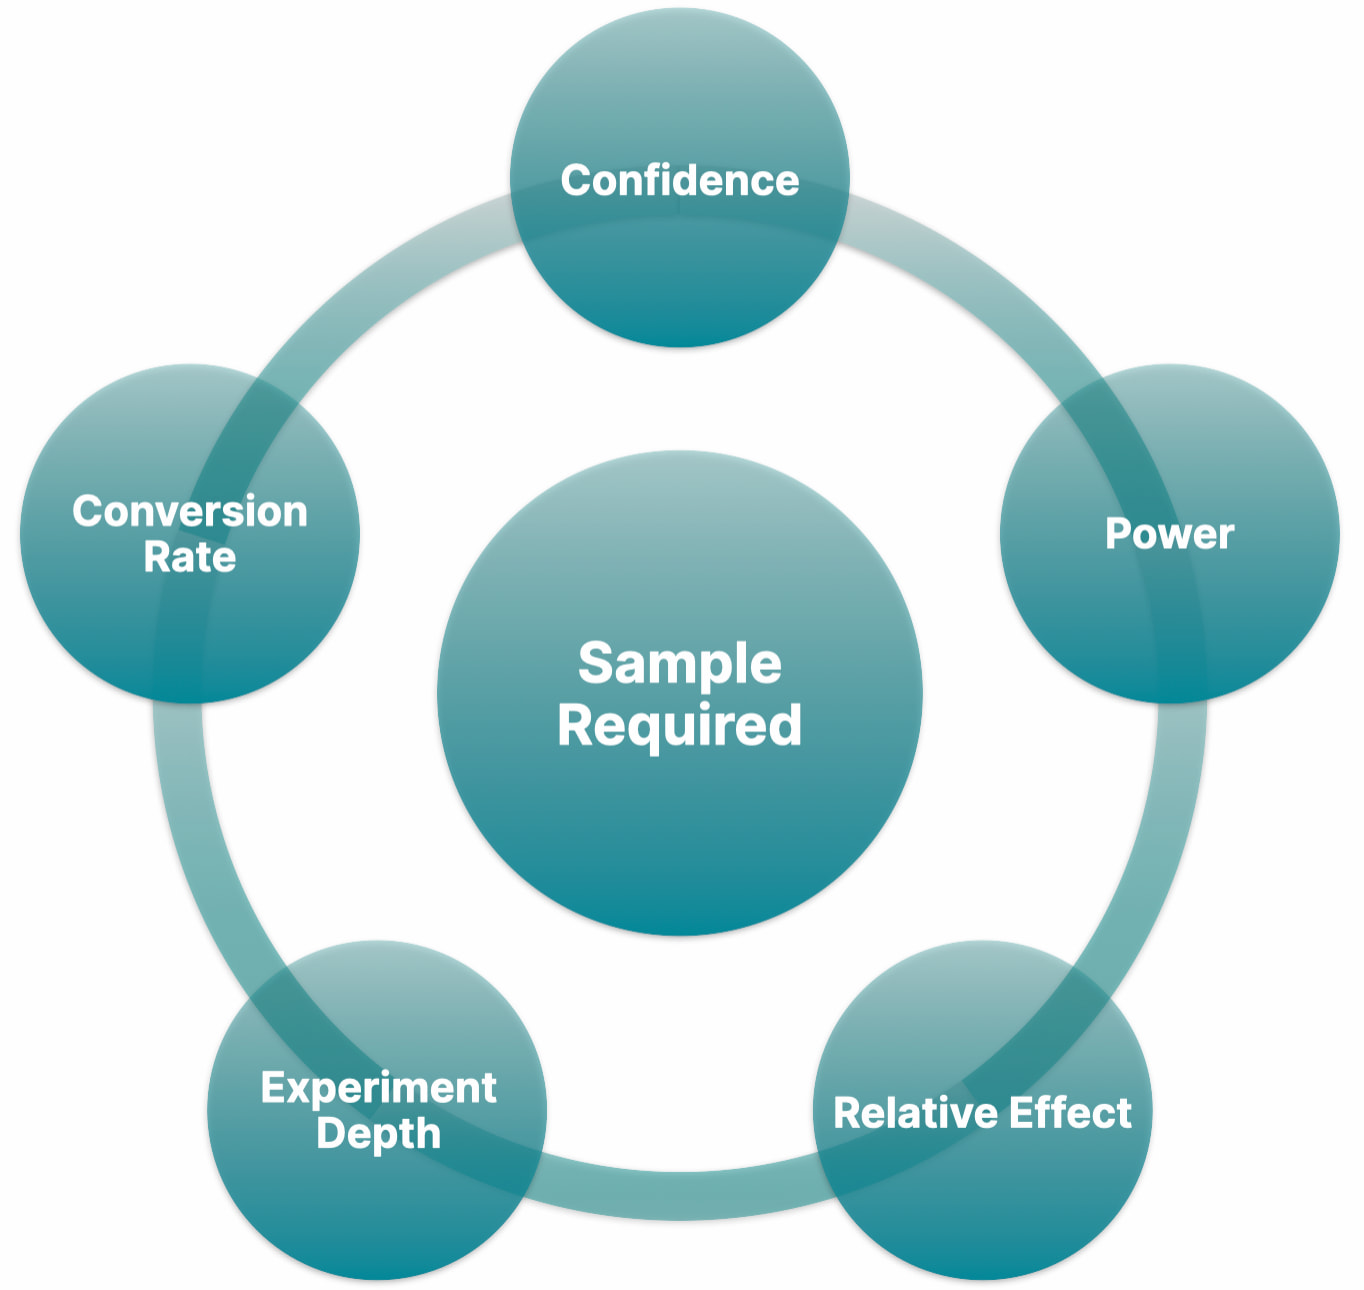
5 Inputs to Sample Size
Confidence level of the experiment
As a rule of thumb we use 90%.
Increasing confidence decreases error but requires increased sample
Power of the experiment
As a rule of thumb we use 80% power.
Increasing power decreases error but requires increased sample
Relative effect (or Lift!) that we would like to resolve
Decreasing the relative effect requires increased sample
Experiment size or depth (number of variants)
Increasing the experiment depth requires increased sample
Experiment conversion rate
A conversion rate closer to 0% or 100% requires increased sample
Sample size determines test duration
Sample Required: The amount of sample required to resolve effects with confidence
Traffic: The amount of users entering the experiment over time
Experiment Duration: The duration required (days, weeks, mail runs) to reach the required sample.
We sample size an experiment to make sure it will not take an unreasonable length of time in order to detect the changes you are trying to measure.

In summary
STEP 1: Think about what type of test you are going to run, and how
STEP 2: Collect the right data
Target the right users on the right page
Exclude irrelevant users so you don’t waste precious resources
Check all tagging and analytics for errors
STEP 3: Analysing and interpreting results
Sample size
Take your time interpreting a result and ask for help if you need it
Return to Basics: Analytics & Interpretation in A/B Testing
Here you can watch Ellie deliver this talk while at a recent webinar hosted with the team at Convert.com
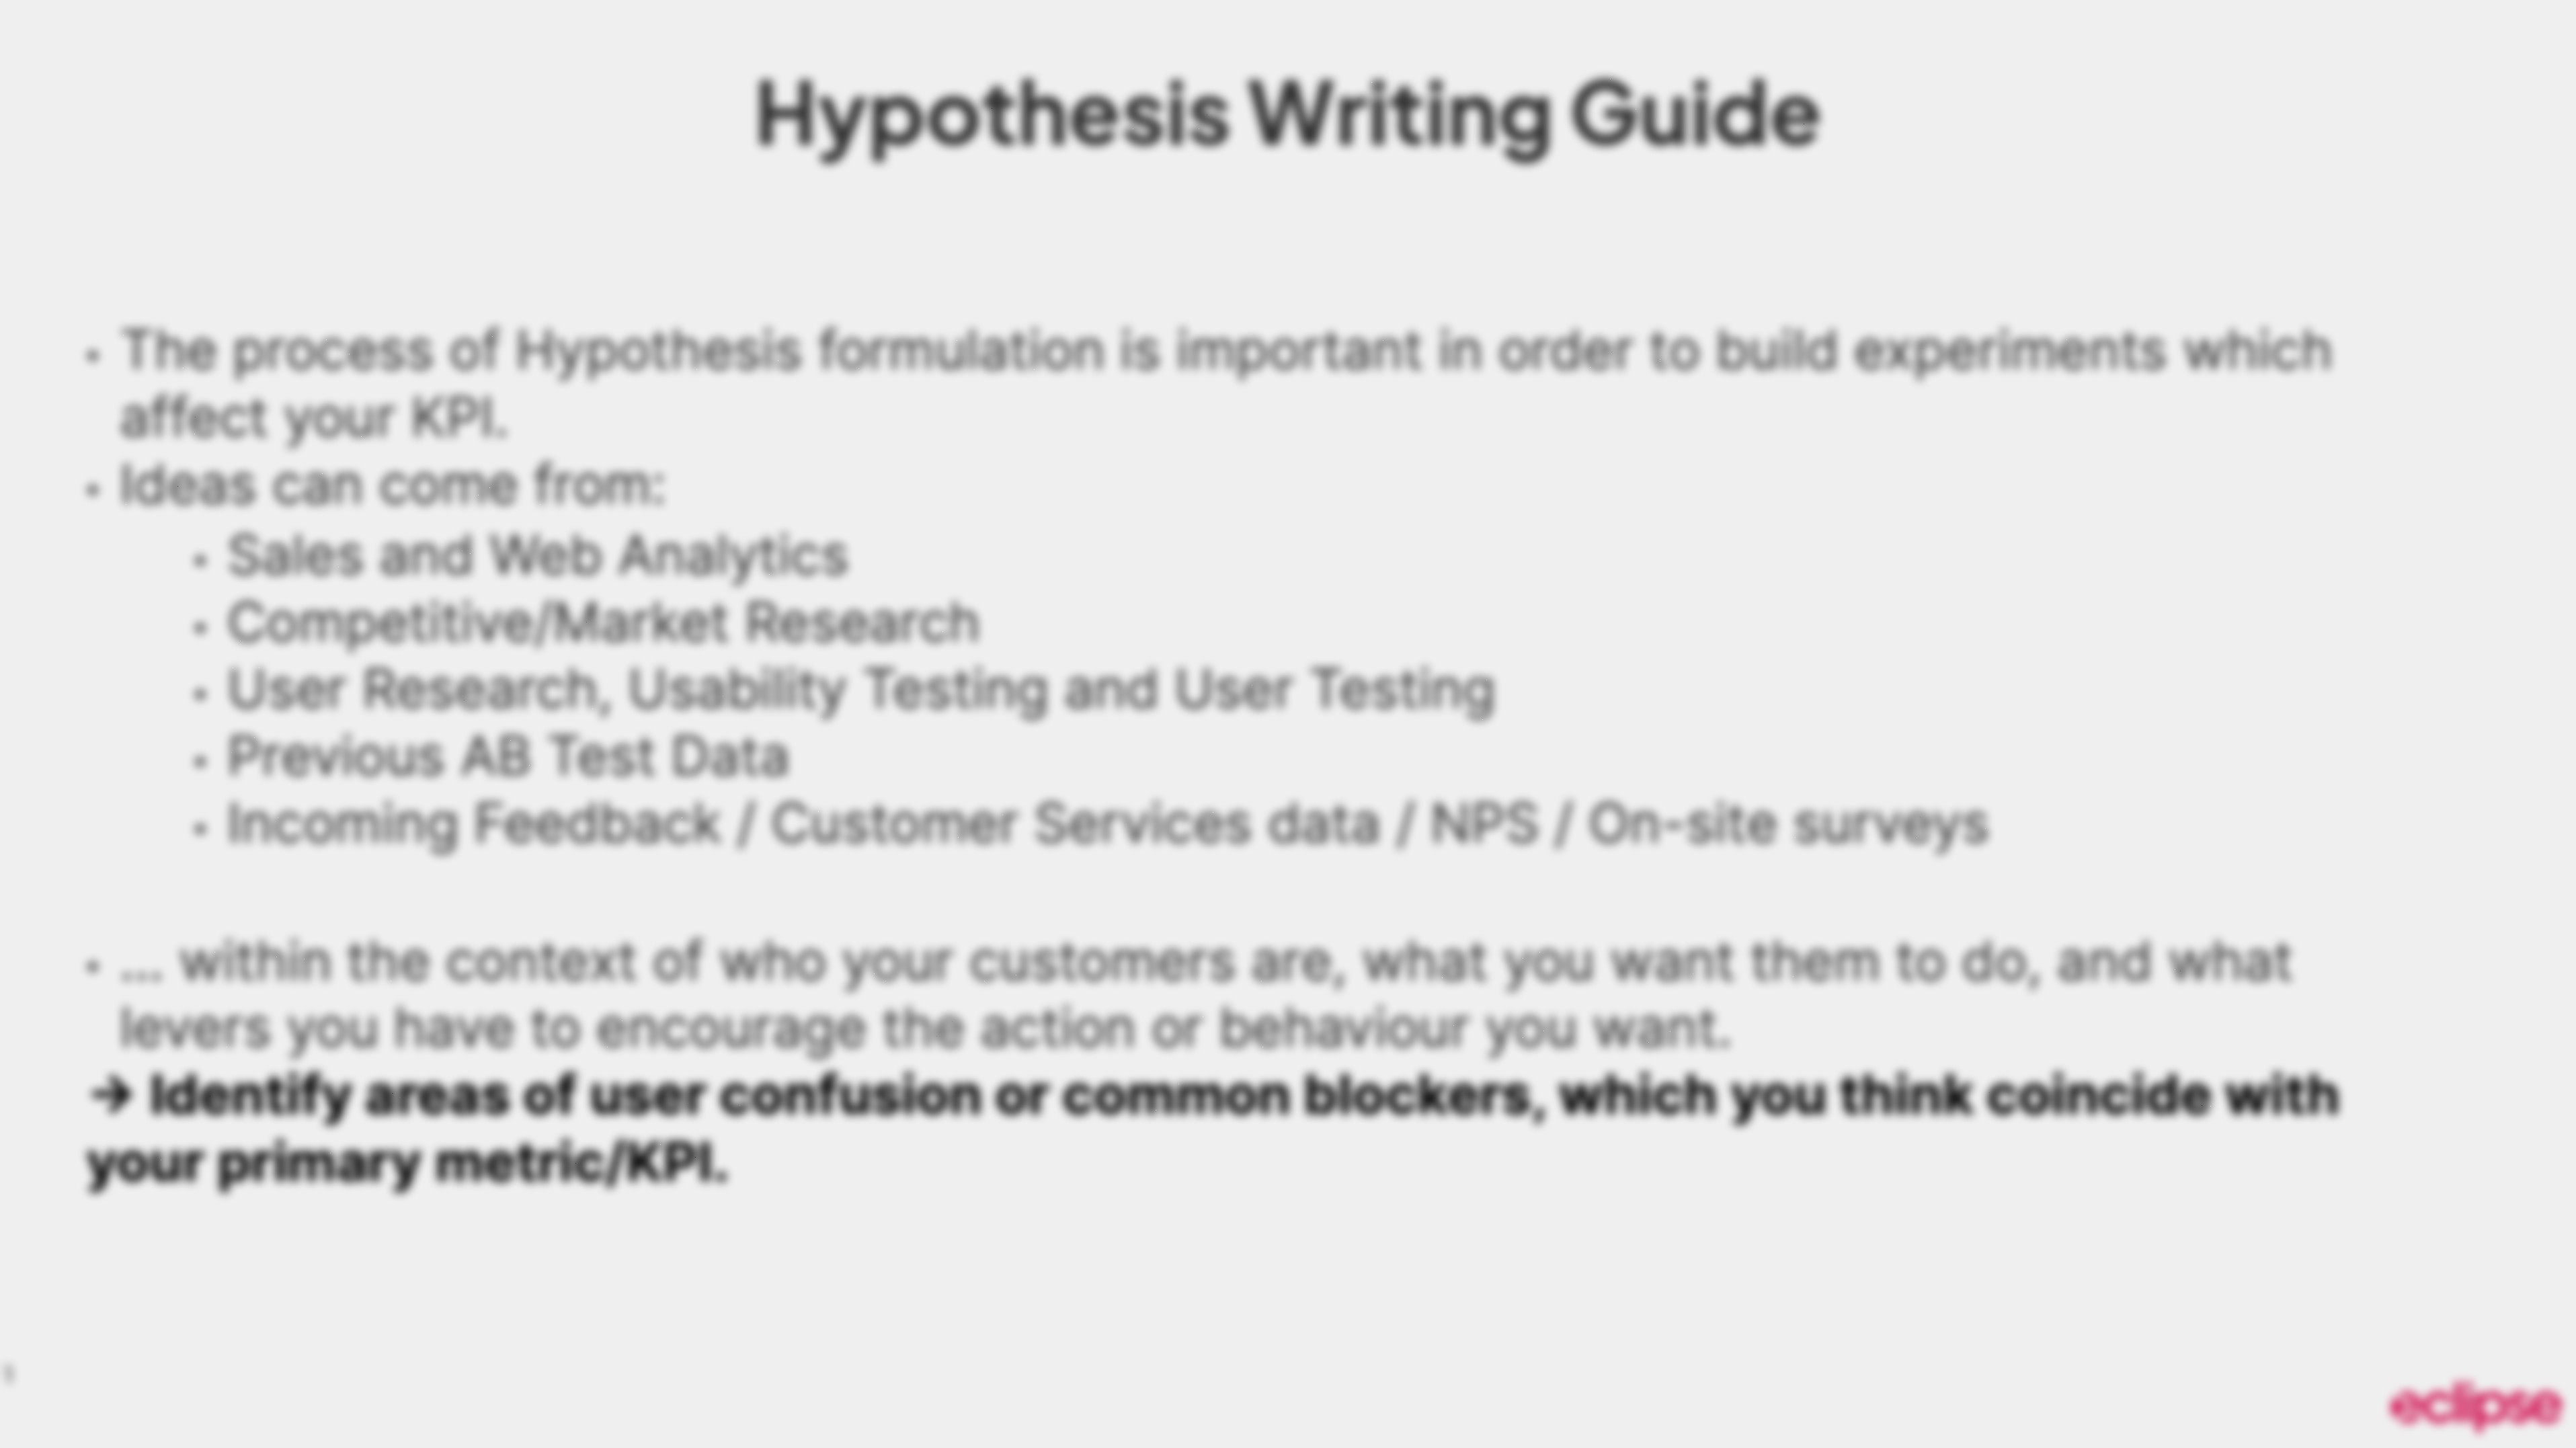
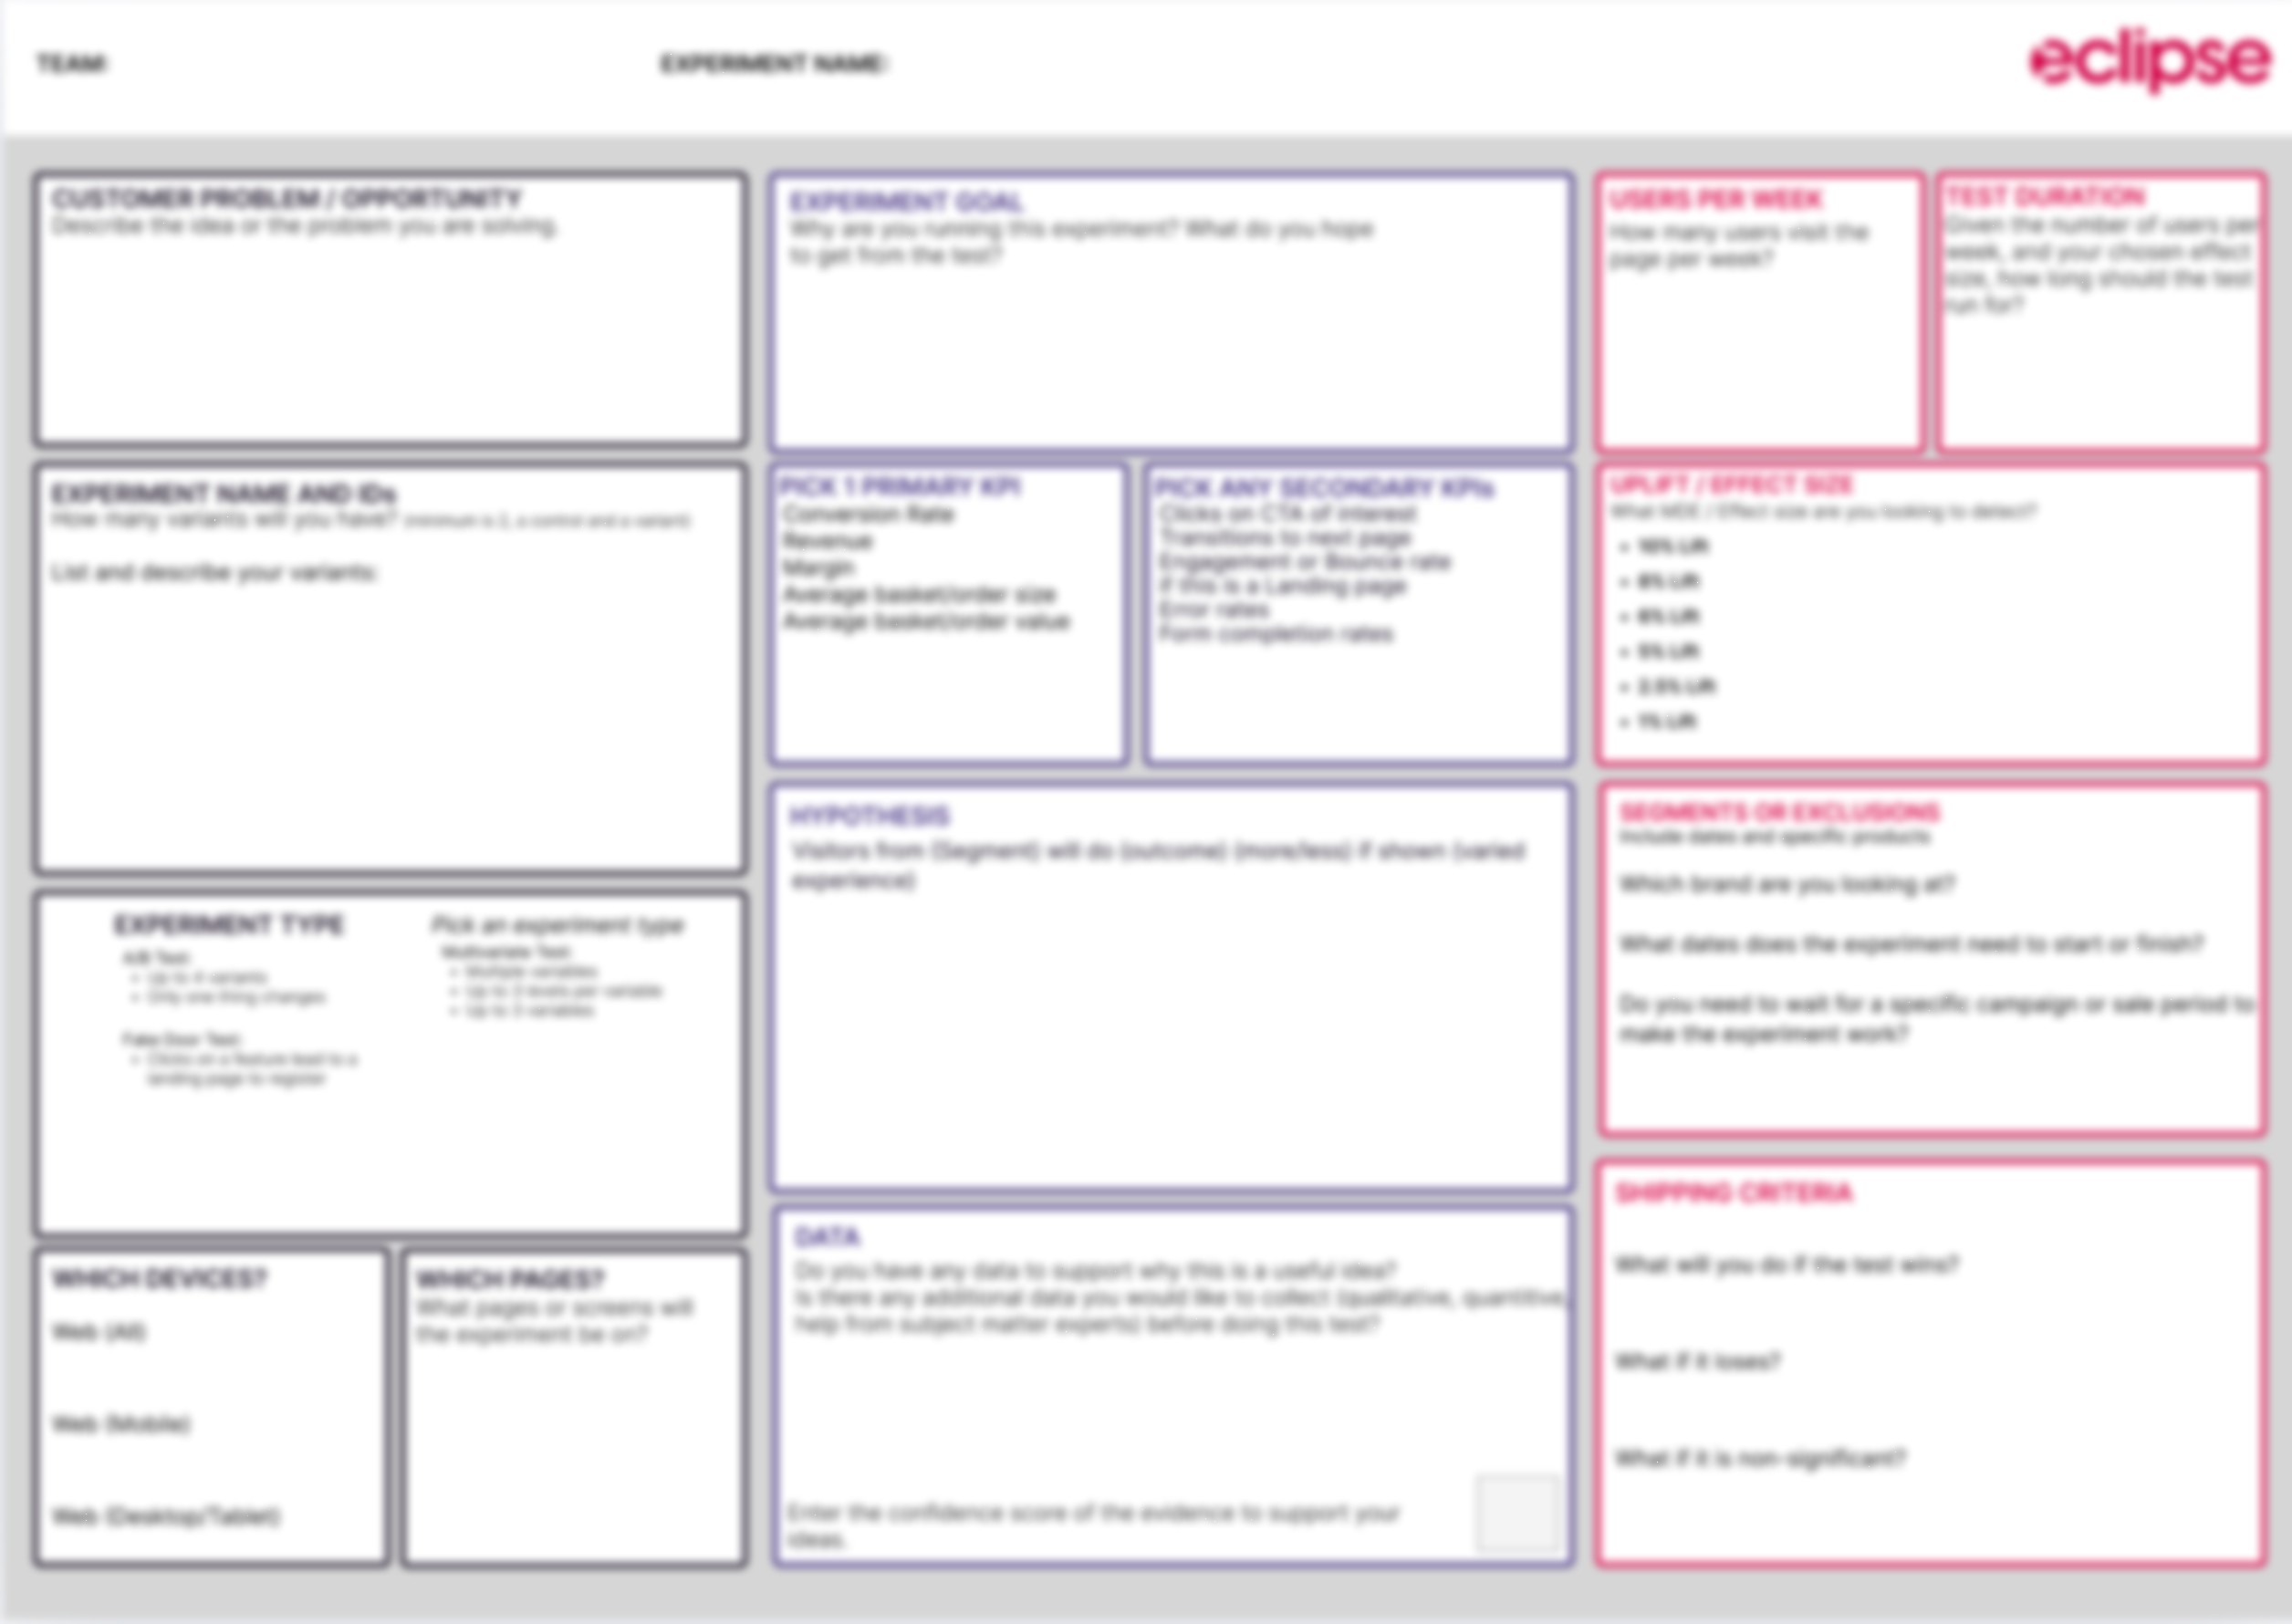
Please enter your details and we’ll email you the FREE Hypothesis Writing Guide and Experiment Canvas
About Ellie
.webp)
If you enjoyed Ellie's talk or are making use of the resources here and want to know how you can implement them, please get in touch: connect with Ellie on Linkedin or use our contact form.
Ellie has over 13 years experience in the data and experimentation industry.
In that time, she has helped businesses to ship experiments at scale, grow their data and product capability and create more value from their experimentation programme.
She is the Head of Consulting at Eclipse, an experimentation-focussed agency in the UK.